EnergyPlus has rich support for hourly and sub-hourly reporting, but as
a model becomes larger and more complex, the simulation output size can
become unwieldy for many existing tools. This can result in
prohibitively long load-times just to view your simulation results.
Timestep attempts to be a better solution, offering a clean,
user-friendly and near-instanteous querying interface, as well as modern
data visualization capabilities. It accomplishes this by using the
EnergyPlus SQLite Output reporting, and can load and visualize very
large simulation output files in seconds, rather than minutes.
- Native support and install packages for MacOS and Windows.
-
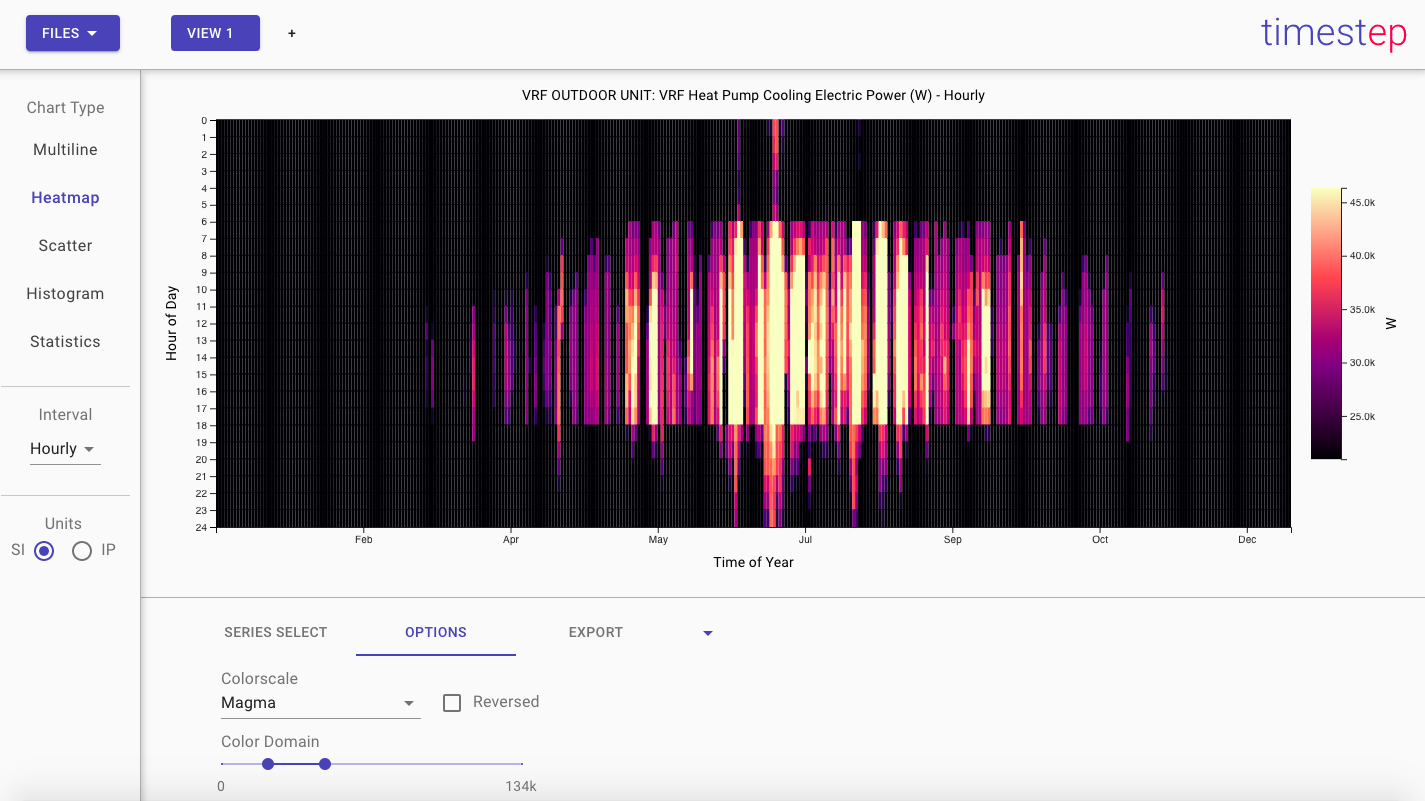
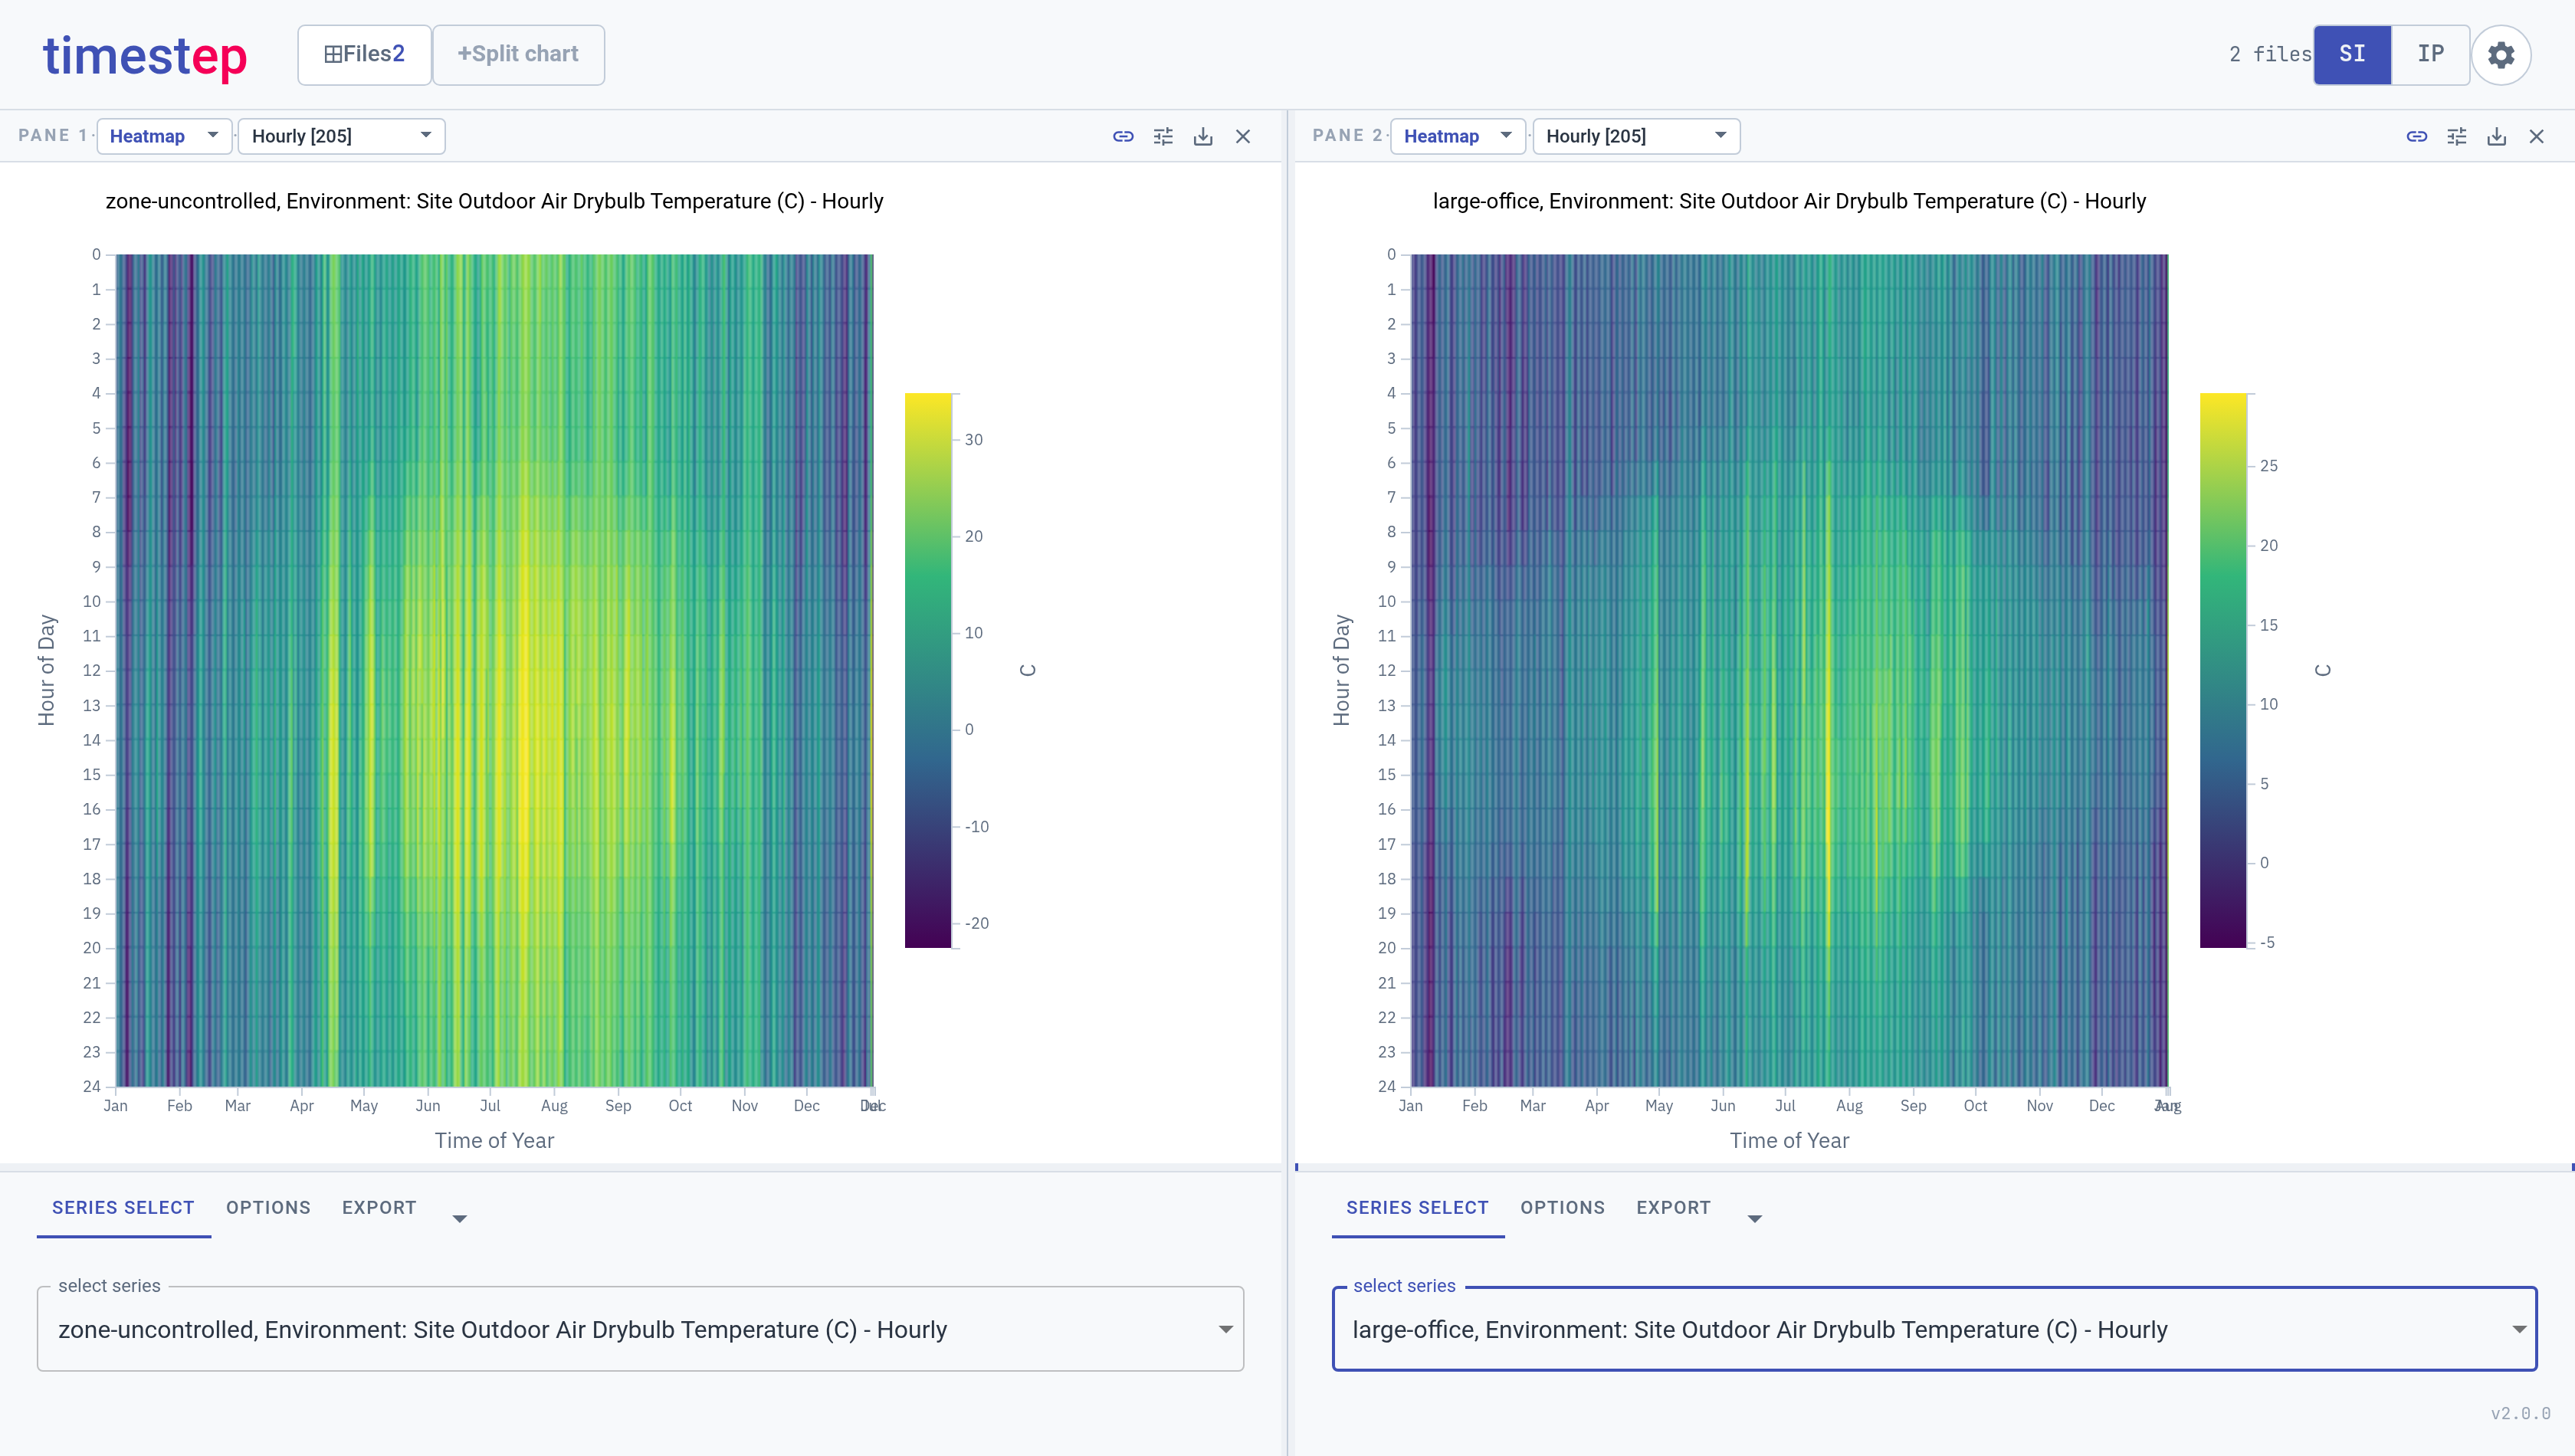
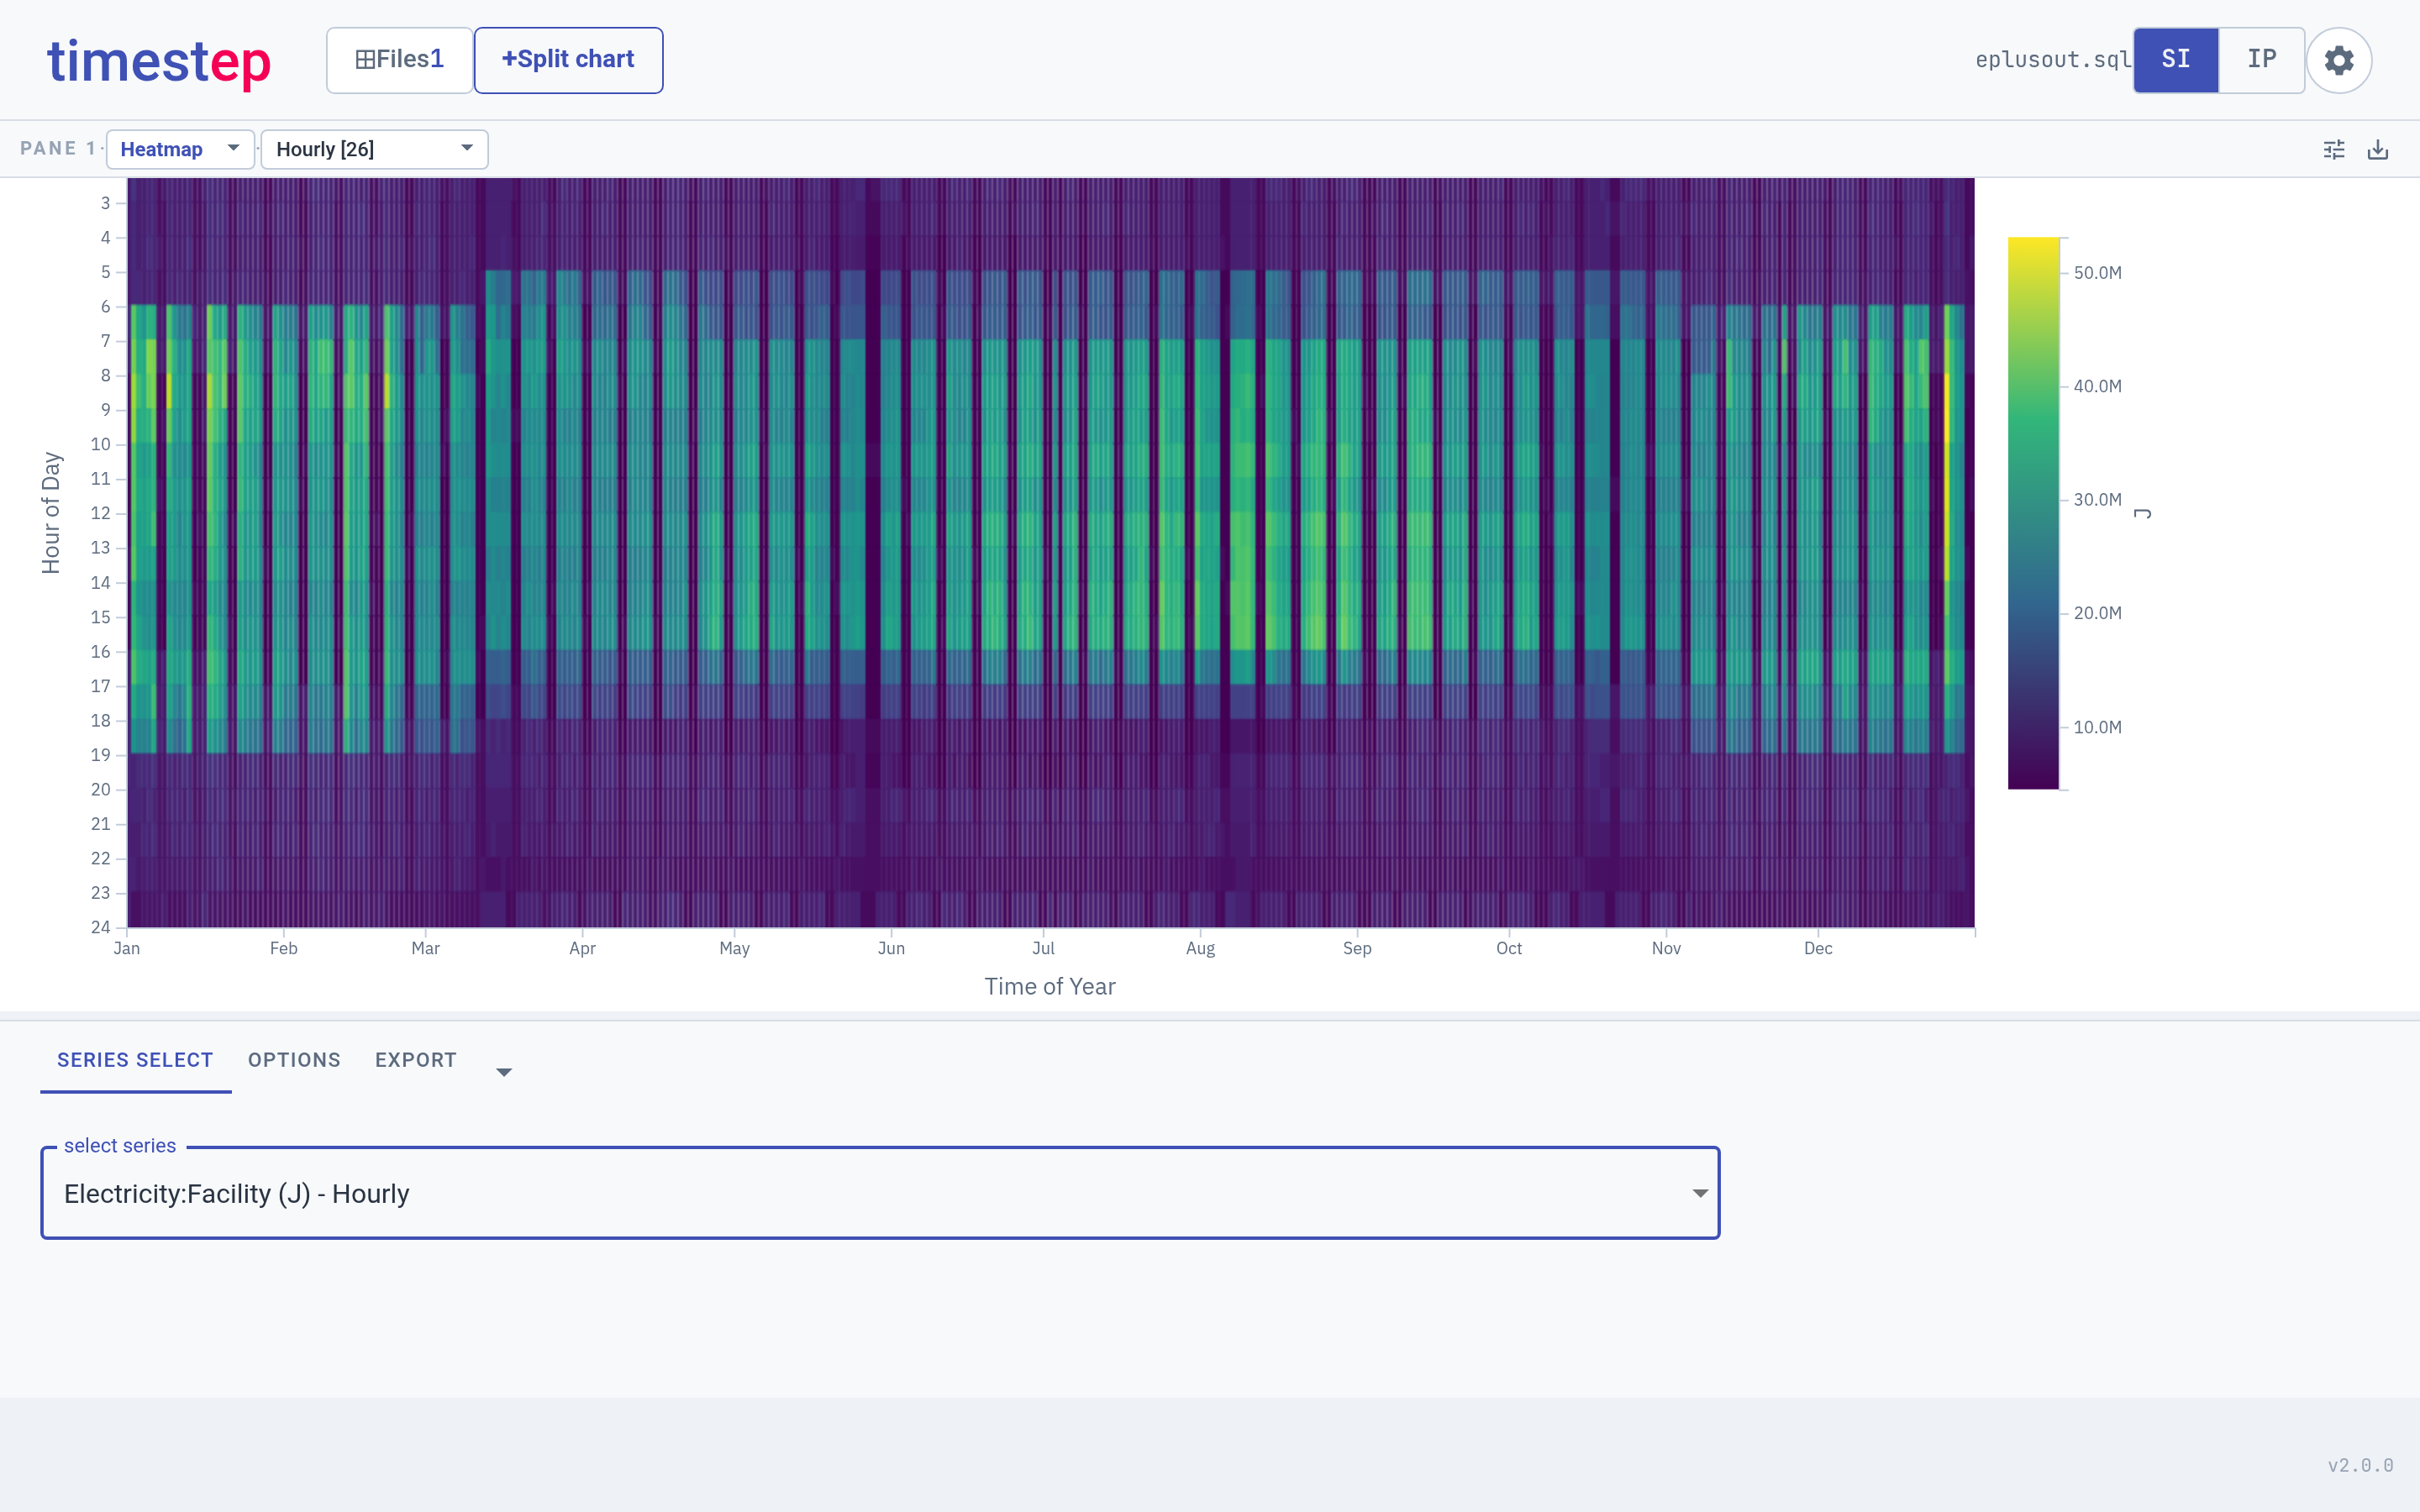
Heatmap, Multi-Line, Scatter Plot, Histogram, and Statistical Summary
outputs
- CSV and clipboard export
- Saved sessions and multiple views within a session
- Support for multiple simulation files
-
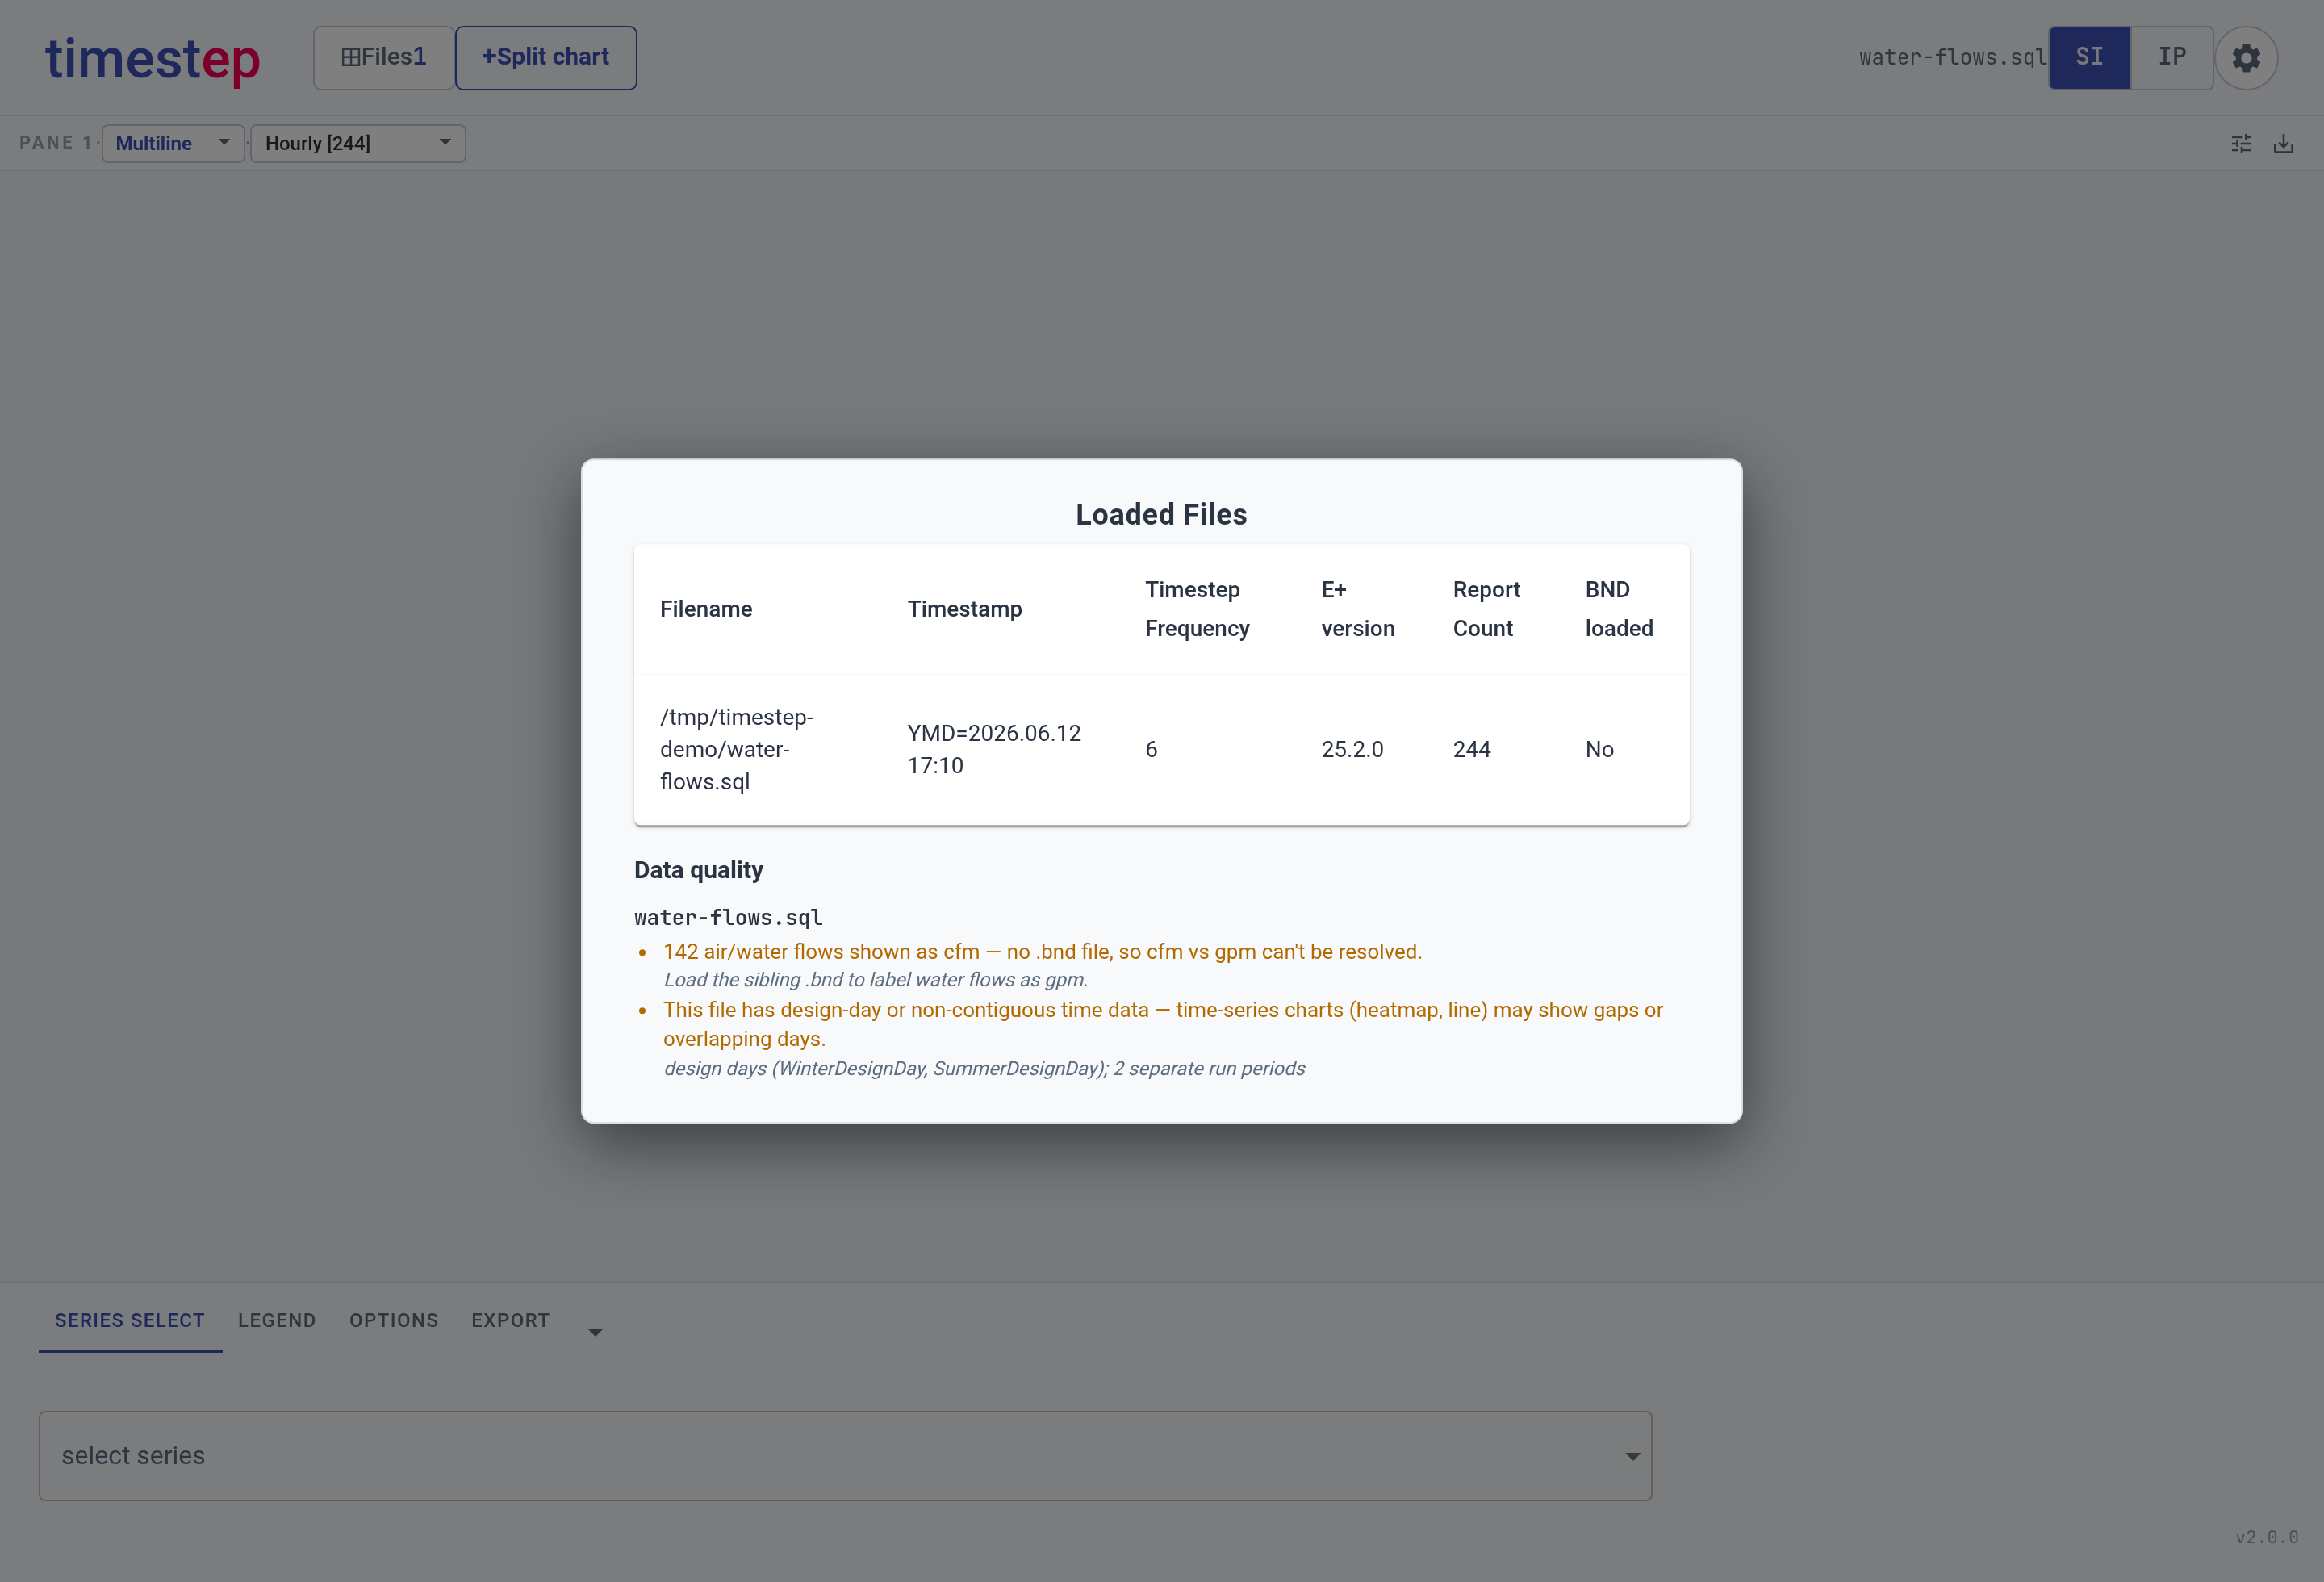
Auto-detection and parsing of BND files for more contextual IP units
conversion.